Being able to start snort with just a few mouse clicks isn't all that impressive if you don't realize what its doing. Fortunately, the Network Security Toolkit comes bundled with the php-base package from http://secureideas.sourceforge.net/.
The php-base package makes it easy to examine the alerts reported by snort. The following will take you through the basics and get you started:
From the main panel of the Network Security Toolkit WUI, we will again select the
Snortlink under theNetworkingsection. Look at the row labeledIntrusion Dectectionas shown in the following:
Since we've already started snort, there will be several new options available to us. To access the php-base interface, we need to click on the big button labeled
ACID Interface For
	  Snort
as shown below: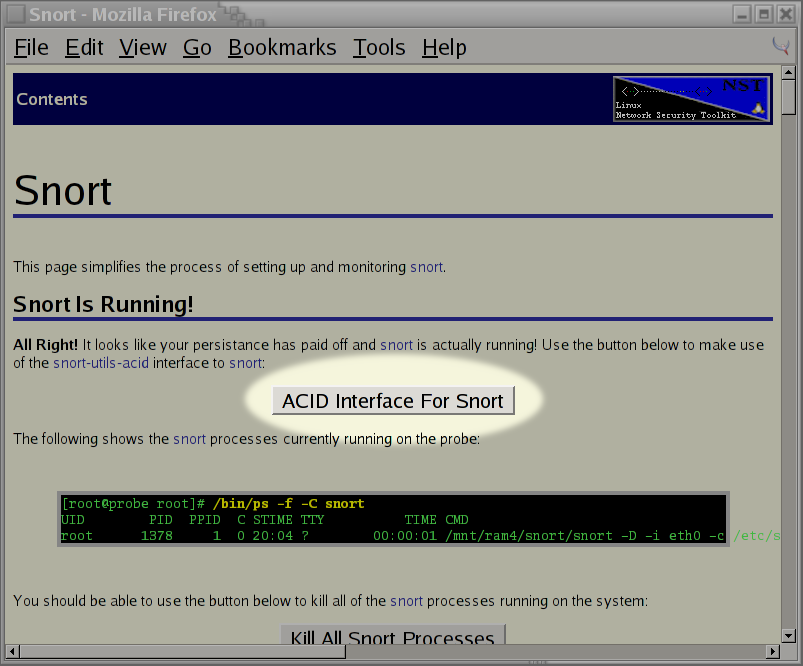
Since this is the first time we've attempted to use the php-base interface, the database will need to be setup. To do this, we need to select the
Setup pagelink, from the warning page which will appear, to complete the setup process. The page which indicates this, will look similar to:
We now need to click on the button labeled
Create ACID AGin the web page which next appears.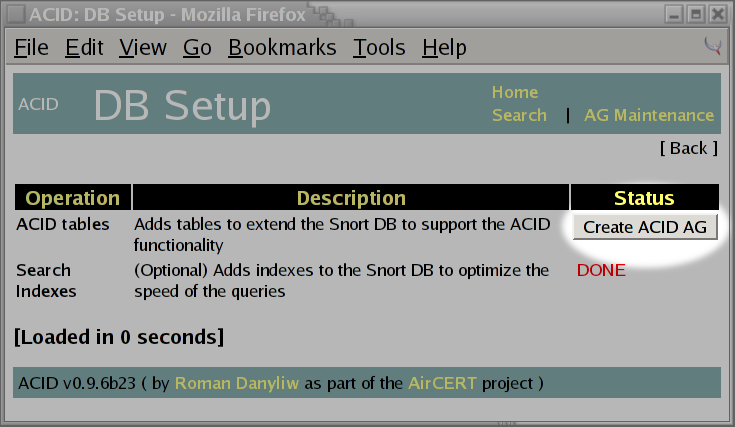
If things go well (I've yet to see this fail), we should see that all of the necessary tables for the php-base interface have now been created. We then take the link to the
Main Page, which appears towards the bottom of the screen shot shown below: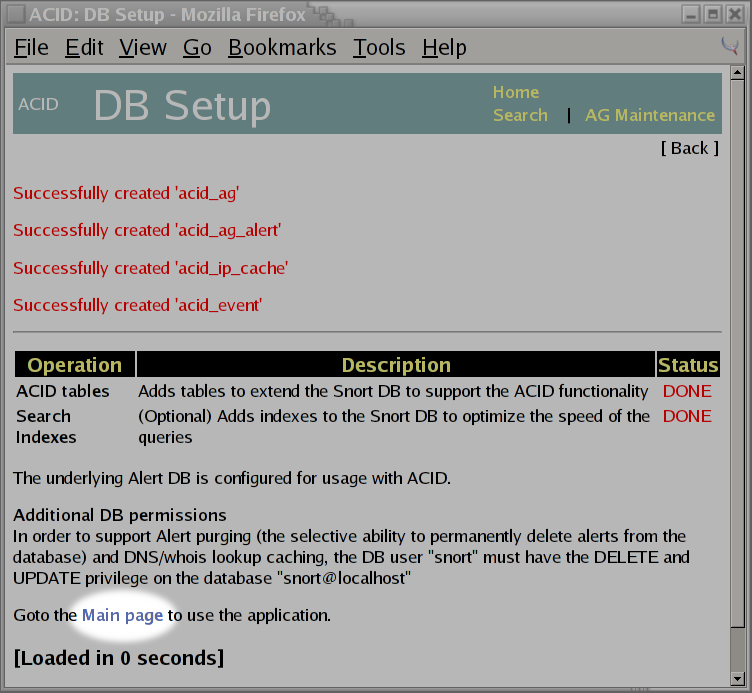
Once back at the main page, we will see a report of snort alerts which have been triggered since we started snort. If you are on a fairly secure local network, you should see a minimal number of alerts.

If you have snort setup on the Network Security Toolkit to monitor your Internet connection, you will start seeing more and more alerts show up as people come by "knocking at your doors". If you are impatient, you should be able to make use of the
ShieldsUP!server at http://grc.com/ to trigger some additional alerts. My firewall does not expose any ports to the Internet, so I don't get a ton of unwanted traffic. However, the following shows what snort detected over a 13 hour period while I was working on this document:
The above indicated that there were a total of 45 alerts triggered. I then used the
Most frequent 5
	  Alerts
link to see which were the most common. The following screen indicates that most of the activity was related to scanning for my existance (however it also appeared that there were some attempts to spread a WORM as well):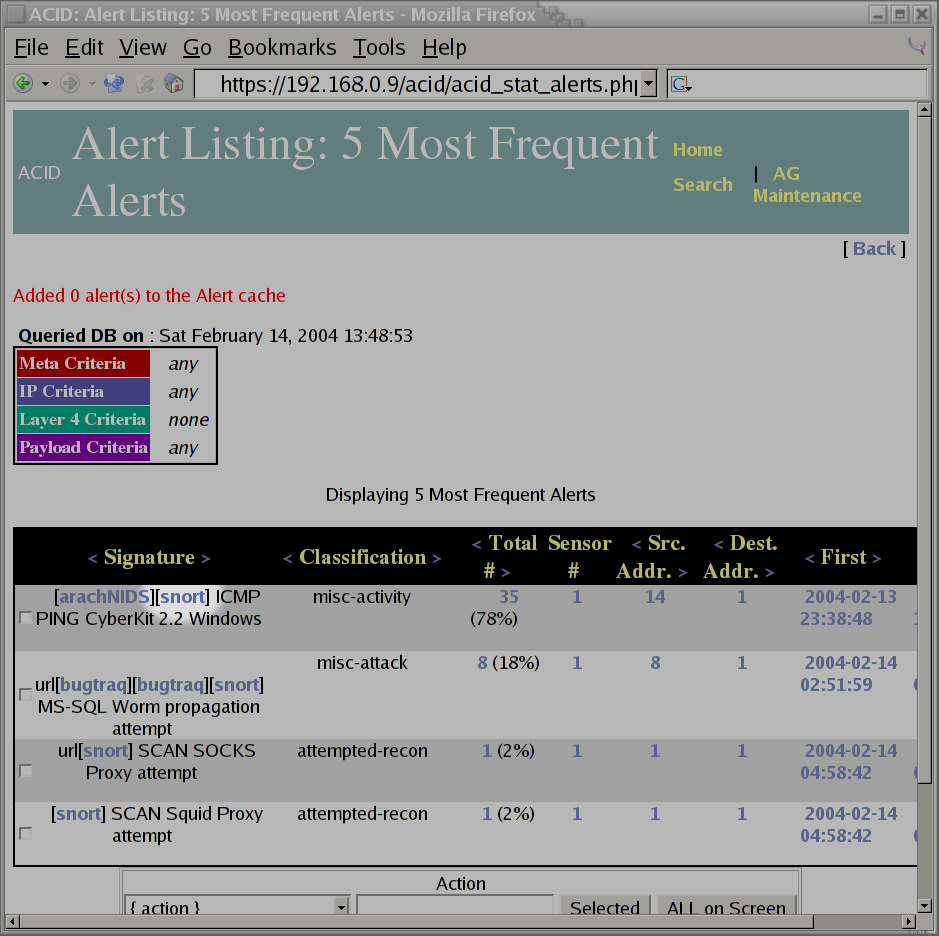
Since I'm not as knowledgeable in the area of network security as Ron, I have to admit that I don't know what half of the problems reported by snort really indicate. So, when I see that there were 35 alerts related to a
PING CyberKit 2.2 Windows(as shown in the previous screen shot), I don't know if I should worry about it or not. Fortunately, the php-base interface provides links to additional information. So, by clicking on thearachNIDSlink, a new window is displayed showing that this alert is related to someone out on the Internet which is probably using aWindowsutility program to scan for computers on the Internet.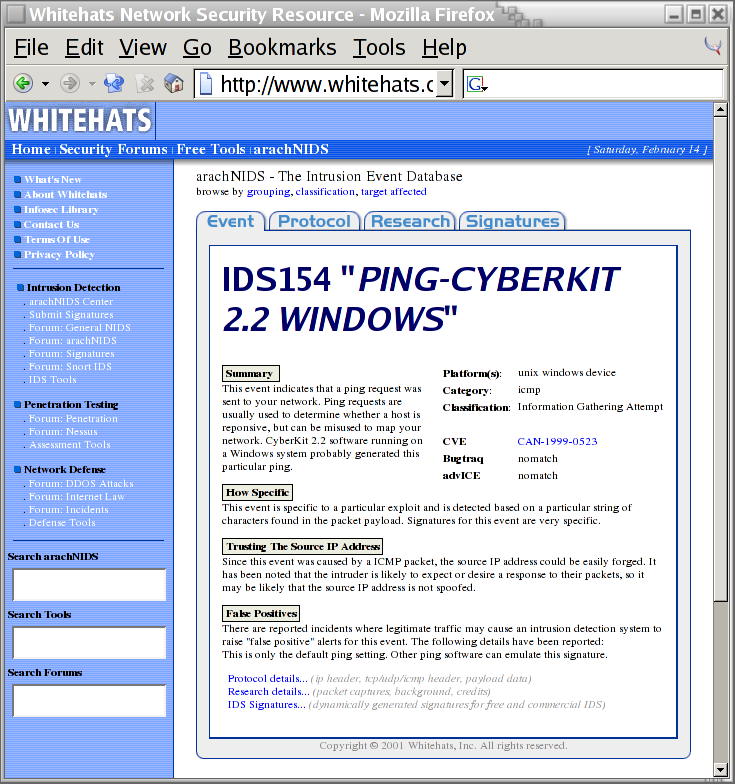
After closing out the window showing help information about the alert, I then select the
Homelink to return to the main page. I'm a bit curious to see if most of the attacks have originated from the same source IP address. I realize that IP addresses can be spoofed, however, I imagine its a bit difficult to spoof an IP address at the scanning stage of an attack. To get this information, I select thesourcelink under theMost frequent 15 addresses:bullet item. This appears towards the bottom right in the window shown below:
The following screen shot indicates that the scans of my system were not all originating from the same system. Interestingly enough, it appears that a lot of them were coming from the
rr.comdomain: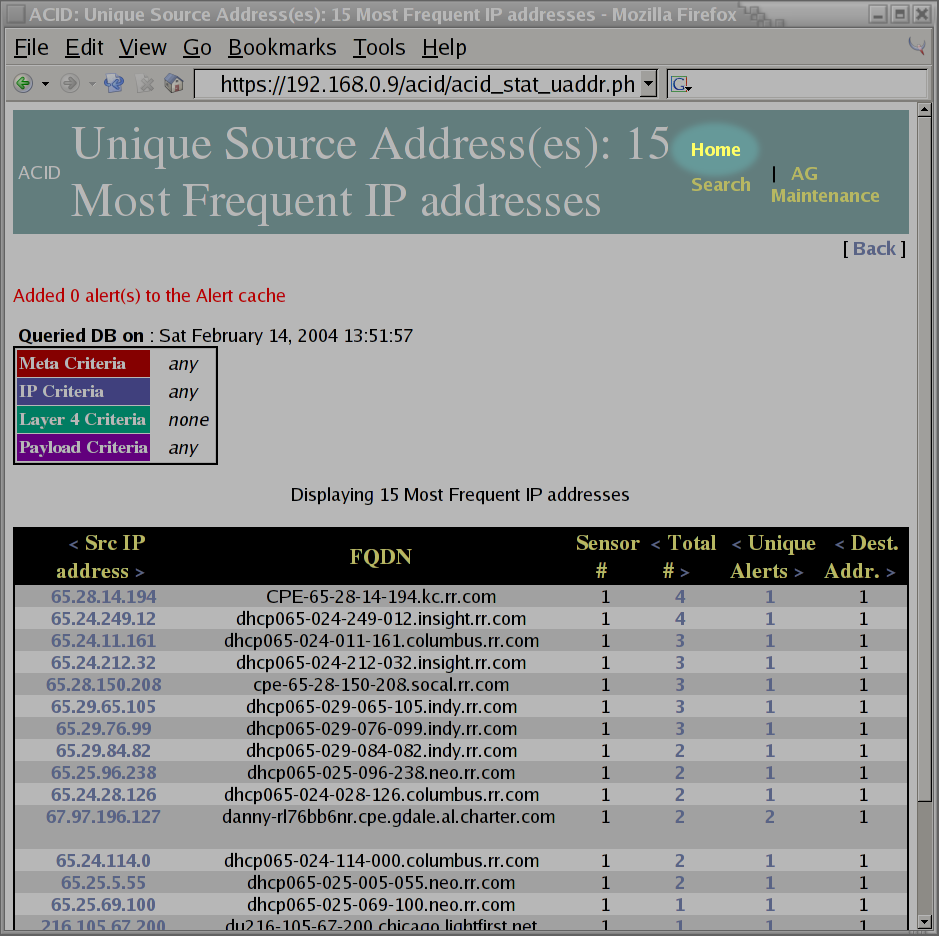
I then select the
Homelink to return to the main page. I decide to check out some of the graphing capabilities of php-base, so I select theGraph Alert Data.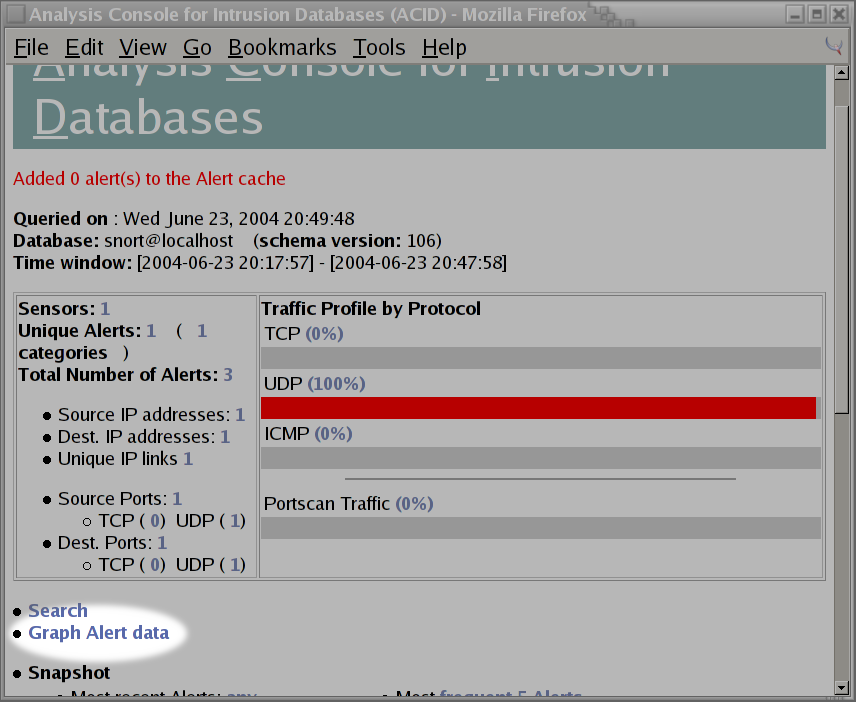
The number of options available to the graphing of snort alerts can be a bit intimidating. This is what I initially see when I enter the
Graph Alert
	  Data
page: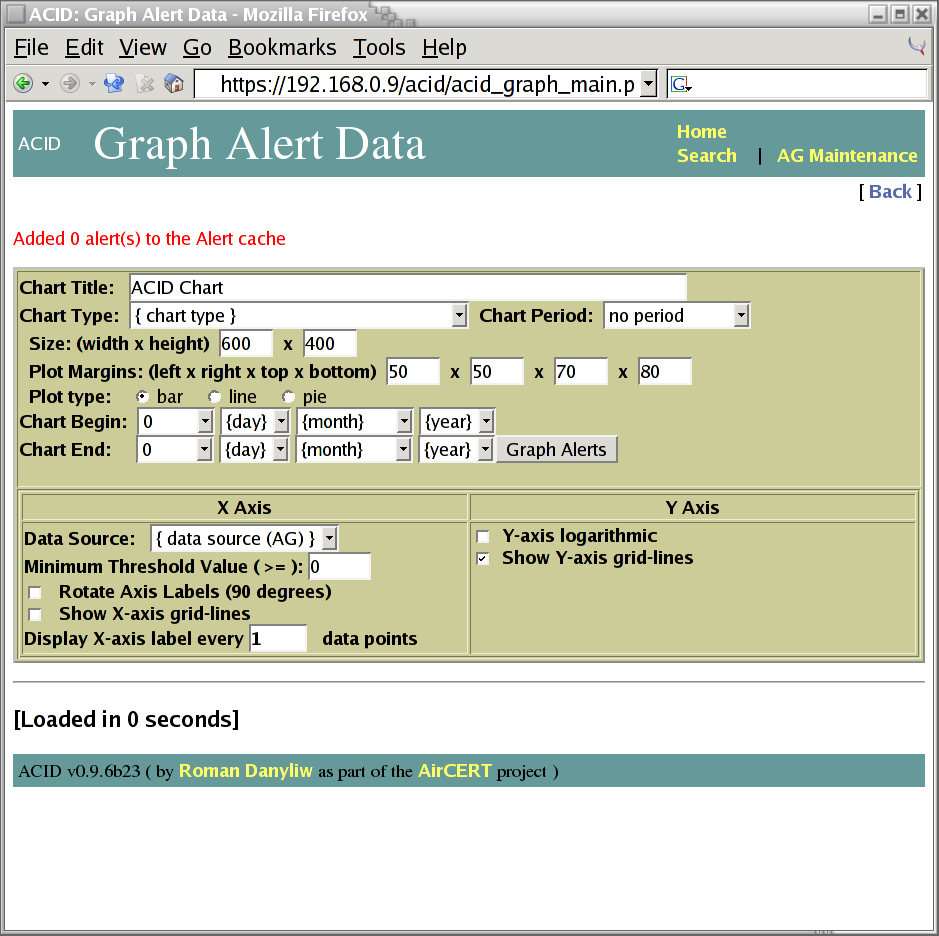
Fortunately, the graphing of data is very forgiving. So, for my first attempt, I set the
Chart TypetoTime (day) vs. Number of Alerts, theChart Periodto7 (a week)and fill in theChart BeginandChart Endtimes. Once I'm happy with my choices, I press the button labeledGraph Alertsshown on the screen shot below: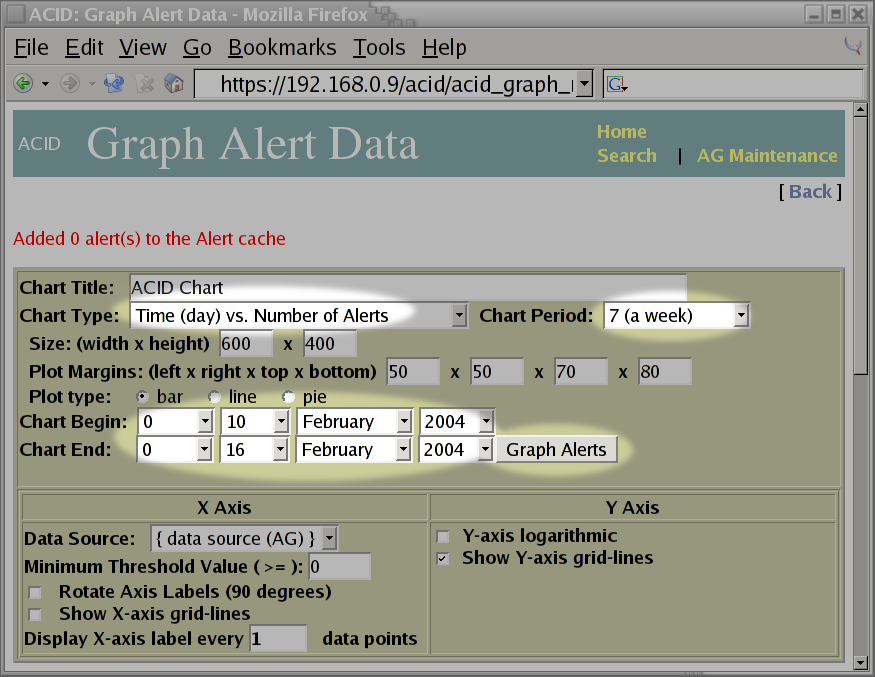
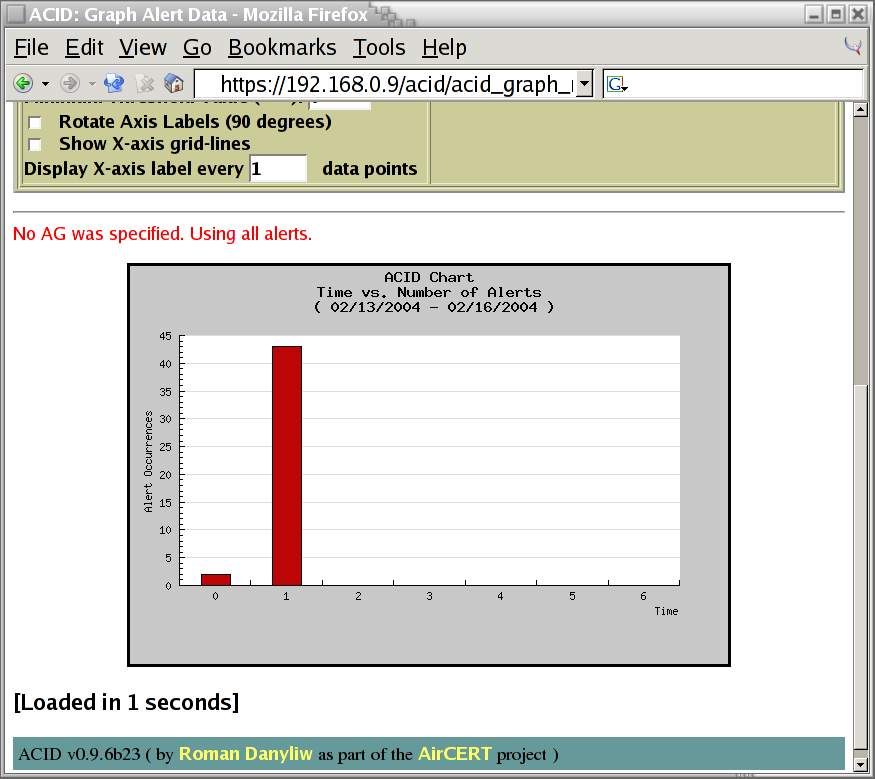
The php-base interface rewards my efforts by presenting me with a bar chart showing the number of alerts per day. This is shown in the screen shot below:
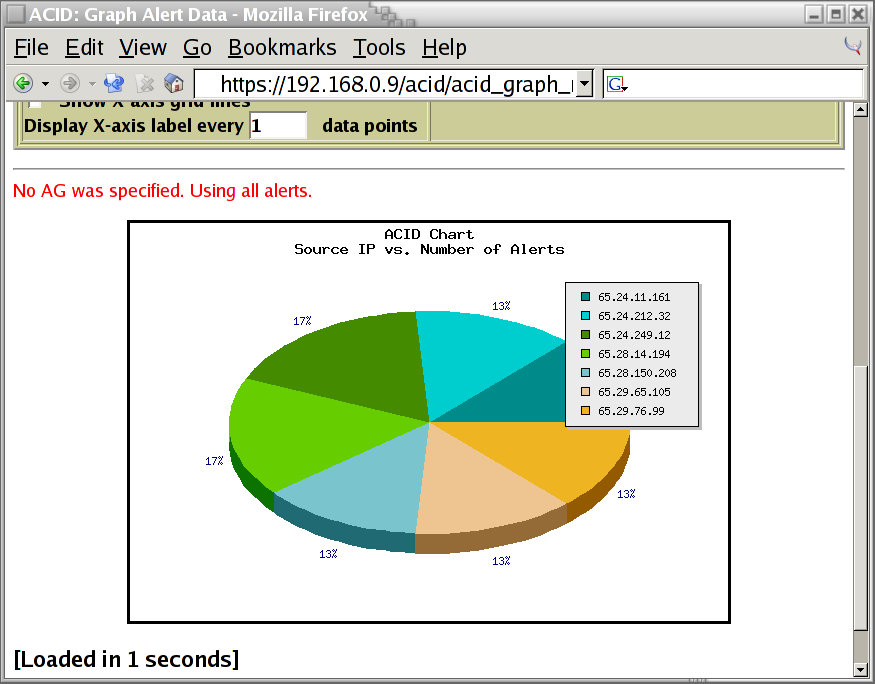
The bar chart was interesting. I'm still curious about the source IP addresses of the systems which have been scanning my firewall. I adjust the graphing options to display this. Notice how the
Minimum
	  Threshold Value
was set to3to limit the chart to only source IP addresses that scanned my system at least three times:
The pie chart presented shows me that there were seven source IP addresses that scanned my system at least three times. I really like how the key shows the actual IP address associated with each pie section:
This concludes the "mini tour" of the php-base interface. We've only touched upon the tip of what can be done, but it should be enough to wet your appetite.