Traffic Monitoring With bandwidthd
The bandwidthd package at http://bandwidthd.sourceforge.net/ monitors the amount of traffic being received/transmitted by specific machines and or subnets. Once a particular machine or subnet has generated enough traffic, bandwidthd then provides a graph of traffic associated with the machine or subnet.
In order to bring up bandwidthd using the Web User Interface, you will first need to click on the
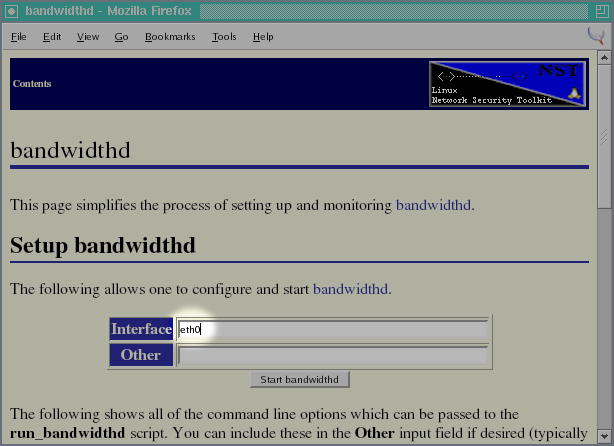
bandwidthdlink which appears in theNetworkingtable of the WUI. Look at the row labeledMonitorsas shown in the following:Before starting the bandwidthd daemon, one has the option of specifying which network interface should be monitored as well as any particular subnets which are to be specifically monitored.
In the setup used in this example, I have my home network connected to the Internet through a firewall/router via NAT. The
eth1interface on my Network Security Toolkit probe is tapped into the traffic which travels between my router and the cable modem. Because of this arrangement, bandwidthd will show all of the traffic from my home network under the single IP address associated with the Internet side of my router. Since my entire network will appear as a single IP address, I don't have a reason at this point in time in specifying any subnet addresses.I will need to change the interface from
eth0toeth1before starting bandwidthd.Now that I've set the interface to
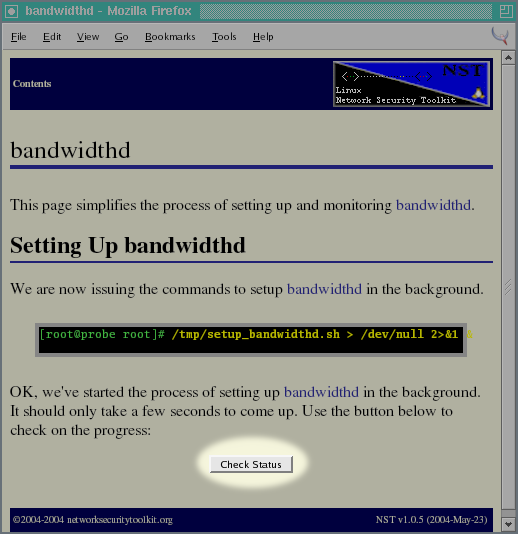
eth1, I'm ready to press the button to start the bandwidthd daemon:The bandwidthd daemon starts up pretty quickly (it only takes a few seconds). So, I typically give the Network Security Toolkit probe a few seconds to get going and then press the button.
If things go well (which they should unless you specify unsupported options), one should see the screen indicating that bandwidthd is running. One can jump to the bandwidthd interface by clicking on the button.
When you first bring up the bandwidthd interface, you are likely to see a nearly blank page indicating that “bandwidthd is collecting data...” as shown below.
Eventually, enough time will have pass and bandwidthd will display network traffic information. When a machine or subnet generates enough traffice (think 1MB), bandwidthd will provide a link to a graphic chart of the traffic associated with the machine or subnet. In the page below, I will click on the
65.29.66.13link to see what type of traffic was occurring:Actually, before clicking on the link, I'm going to investigate the
69.44.123.39IP address shown in the table. In catches my eye as there was a fair amount of traffic. I will start my investigation by opening up a ssh connection to my Network Security Toolkit probe and make use of the whois, host and wget tools:Figure 2.20. Investigating IP 69.44.123.39
[root@probe root]#whois 69.44.123.39Williams Communications, Incorporated WCG-BLK-4 (NET-69-44-0-0-1) 69.44.0.0 - 69.45.255.255 Akamai Technologies WLCO-TWC02103579-AKAMAI-TECH-BROADVIEW (NET-69-44-123-32-1) 69.44.123.32 - 69.44.123.63 # ARIN WHOIS database, last updated 2004-05-29 19:15 # Enter ? for additional hints on searching ARIN's WHOIS database.[root@probe root]#host 69.44.123.3939.123.44.69.in-addr.arpa domain name pointer 69-44-123-39.wcg.net.[root@probe root]#wget -O - http://wcg.net/--17:07:32-- http://wcg.net/ => `-' Connecting to 192.168.0.2:3128... connected. Proxy request sent, awaiting response... 200 OK Length: 127 [text/html] 0% [ ] 0 --.--K/s ETA --:--<HTML> <HEAD> <META HTTP-EQUIV="refresh" CONTENT="0; url=http://www.wiltel.com/services/internet/index.html"> </HEAD> </HTML> 100%[====================================>] 127 124.02K/s ETA 00:00 17:07:32 (124.02 KB/s) - `-' saved [127/127][root@probe root]#wget -O - http://www.wiltel.com/<html> <head> <style> ... lots more output ... </style> <meta content="WilTel, overview"> <title>WilTel Communications</title> <style type="text/css"> ... lots more output ...[root@probe root]#The brevity of the whois output made me a bit suspicious (maybe the kids had infected one of the systems with more Spyware). So, I then tried running the IP address down to a host that I could access with wget. The output leads me to believe that this traffic is related to my wife's IP phone. However, I may keep an eye on this or further investigate the traffic with a tool like wireshark (it seemed a bit too difficult to get information if it is indeed a real service).
Note
As a followup, I'm less suspicous of this IP address as time goes by. If this site were related to Spyware, I would expect bandwidthd to show traffic to the site on a continual basis. However, after letting bandwidthd run for several hours, I noticed only the short burst of traffic. This suggests to me that the traffic was triggered by someone within my house as opposed to a background Spyware process.
In looking at the traffic graphs for my home network, I see that most of the traffic was due to HTTP/TCP traffic. As my younger son had been catching up with the daily comics while I was getting my screen shots for this part of the document, the report seemed reasonable.


This concludes a sample session of using bandwidthd from a running Network Security Toolkit probe. It should be enough to get you started at exploring the traffic in your local network.